Royal Holloway, University of London
- Offer Profile
- MR是一组工具,该工具实现了用于处理1D信号,2D图像和3D数据量的多尺度方法。
MR多分析分析软件提供的内容
- Scale and Resolution
- Image and Data Analysis
- Extensive Signal and Noise Modeling
- 创新和性能
- Financial Modelling, Nowcasting, Prediction
- Wavelet and multiresolution transforms, ridgelet and curvelet transforms
产品介绍
MR/1: Multiresolution and Applications
- MR/1 is a set of software components developed by CEA (Saclay, France) and Nice Observatory. This project originated in astronomy, and involved the development of a range of innovative methods built around multiscale analysis. The MR/1 software components include almost all applications presented in the book Image and Data Analysis: the Multiscale Approach . Descriptions of these applications can also be found in many published papers . The goal of MR/1 is not to replace existing image processing packages, but to complement them, offering the user a complete set of multiresolution tools. These tools are executable programs, which work on a wide range of platforms, independently of current image processing systems. They allow the user to perform various tasks using multiresolution, such as wavelet transforms, filtering, deconvolution, and so on. Programs can also be called from a JAVA interface. A set of IDL (Interactive Data Language, by Research Systems Inc.) and PV-Wave (Visual Numerics Inc.) routines are included in the package which interface the executables to these image processing packages. MR/1 is an important package, introducing front-line methods to scientists in the physical, space and medical domains among other fields; to engineers in such disciplines as geology and electrical engineering; and to financial engineers and those in other fields requiring control and analysis of large quantities of noisy data.
小波和多尺度变换
Many 1D and 2D wavelet transforms and other multiscale methods, such the Pyramidal Median Transform or the lifting scheme, have been inplemented in MR/1.
噪声建模:
-
Our noise modeling in the wavelet space is based on the assumption that the noise in the data follows a distribution law, which can be:- 高斯分布
- 泊松分布
- 泊松 +高斯分布(CCD检测器中的噪声)
- Poisson noise with few events (galaxy counts, X-ray images, point patterns)
- 斑点噪音
- Correlated noise
- 均方根地图:我们具有每个数据值的噪声标准偏差。
如果噪声不遵循这些分布中的任何一个,我们可以从以下任何假设中得出噪声模型
- 它是静止的,我们有一个子图像,其中包含噪声的实现,
- it is additive, and non-stationary,
- 它是乘法和固定的,
- it is multiplicative, but non-stationary,
- it is undefined but stationary,
- it is additive, stationary, and correlated.
应用程序:
- 1. Descriptions of these applications can also be found in many published papers .
2.General tools: data conversion, simulation, statistic, Fourier analysis, mathematical morphology, principal component analysis, ...
3. 1d和2d小波变换和重建..数量对象操纵:统计,频段提取,比较,...
4. Multiresolution support detection.
5. 1D and 2D filtering taking into account the different noise models. Many methods have been implemented (11 in 1D and 18 in 2D) including standards like K
Sigma thresholding, SURE, MAD, Universal thresholding, Multiscale Wiener filtering, ...
6. Image background subtraction.
7. Image deconvolution: nine standard deconvolution methods are available (MEM, LUCY, Landweber, MAP, ...), and five wavelet based methods.
8.图像注册。
9. Lossy and lossless image compression. the PMT (median based compression method) and the bi-orthogonal wavelet transform allows both the user to
reconstruct an image (or a part of an image) at a given resolution. Lossless image compression is based on the lifting scheme.
10.使用多尺度视觉模型在1D和2D数据集中进行对象检测和提取。
11. Edge detection and image reconstruction from the multiscale edges. Many standard edge detection methods are available (15) and two wavelet based methods.
12. Contrast enhancement. Standard methods and contrast enhancement methods based on the wavelet transform are available.
13. 1D Wavelet Transform Modulus Maxima (WTMM) representation and reconstruction.
14. 1D Multifractal analysis.
15. Time-Frequency analysis (Short Term Fourier Transform, Wigner-Ville transform).
16.时间序列的现代和预测。
MR/2: Multiscale Entropy and Applications
- “熵”是由于克劳修斯(1865),和the concept of entropy was introduced by Boltzmann into statistical mechanics, in order to measure the number of microscopic ways that a given macroscopic state can be realized. Shannon (1948) founded the mathematical theory of communication when he suggested that the information gained in a measurement depends on the number of possible outcomes out of which one is realized. Shannon also suggested that the entropy can be used for maximization of the bits transferred under a quality constraint. Jaynes (1957) proposed to use the entropy measure for radio interferometric image deconvolution, in order to select between a set of possible solutions that which contains the minimum of information, or following his entropy definition, that which has maximum entropy. In principle, the solution verifying such a condition should be the most reliable. Much work has been carried out in the last 30 years on the use of entropy for the general problem of data filtering and deconvolution. Traditionally information and entropy are determined from events and the probability of their occurrence. Signal and noise are basic building-blocks of signal and data analysis in the physical and communication sciences. Instead of the probability of an event, we are led to consider the probabilities of our data being either signal or noise. Consider any data signal with interpretative value. Now consider a uniform "scrambling" of the same data signal. (Starck et al., 1998, illustrate this with the widely-used Lena test image.) Any traditional definition of entropy, the main idea of which is to establish a relation between the received information and the probability of the observed event, would give the same entropy for these two cases. A good definition of entropy should instead satisfy the following criteria:
- 1.平面信号中的信息为零。
- 2.信号中的信息量与背景无关。
- 3.信息量取决于噪声。如果噪声高或小,给定的信号y(y = x +噪声)无法提供相同的信息。
- 4.熵必须以相同的方式工作,以使具有B + epsilon的信号值(B为背景),并且具有值B -Epsilon的信号值。
- 5.信息量取决于信号中的相关性。如果信号s在噪声上方显示大型功能,则包含大量信息。通过从s中生成一组新的数据,通过随机获取S中的值,大型功能显然会消失,并且该新信号将包含更少的信息。但是数据值将与S相同。
为了迎合背景,我们将多解析的概念介绍给我们的熵。我们将考虑一些数据集中包含的信息是不同分辨率级别的信息的总和。小波变换是我们数据的多尺度分解的一种选择。我们定义位置k和j处的小波系数WJ(k)的信息,为i = -ln(p(wj(k))),其中p是小波系数的概率。然后,通常表示为H的熵被定义为所有位置的总和在所有位置上的总和j,j,j in j in j as l l i. j,对于高斯噪声,我们使用高斯概率分布继续朝这个方向沿着这个方向继续,发现熵,熵,h,是所有位置k的总和(wj(k)^2)/(2 sigma^2 j)(即系数平方,除以两倍的标准偏差平方,给定比例)。Sigma或标准偏差是噪声的(高斯)度量。我们看到该信息与小波系数的能量成正比。小波系数越高,那么概率就越低,并且该小波系数提供的信息越高。 Our entropy definition is completely dependent on the noise modeling. If we consider a signal S, and we assume that the noise is Gaussian, with a standard deviation equal to sigma, we won't measure the same information compared to the case when we consider that the noise has another standard deviation value, or if the noise follows another distribution. Returning to our example of a signal of substantive value, and a scrambled version of this, we can plot an information versus scale curve (e.g. log(entropy) at each scale using the above definition, versus the multiresolution scale). For the scrambled signal, the curve is flat. For the original signal, it increases with scale. We can use such an entropy versus scale plot to investigate differences between encrypted and unencrypted signals, to study typical versus atypical cases, and to differentiate between atypical or interesting signals.
MR/3:3D和多通道数据
- MR/3 deals with the analysis of multi-channel data or 3D data.
3D data can either be a real cube, or a set of images of the same observation, but taken at different times. Multi-channel data can be either 1D or 2D multi-channel:
-
-
-
稀疏图像和信号处理
-
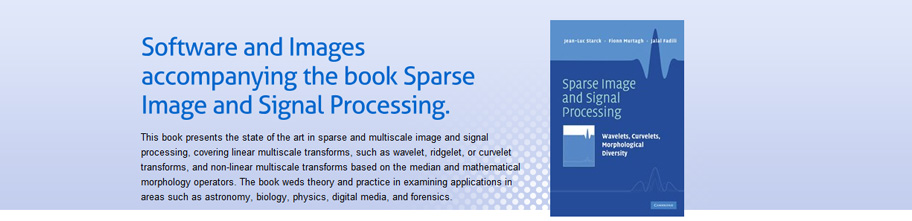
Pyramidal Wavelet Transform on the Sphere
- The global relief data are ETOPO5 land and sea-floor elevation data. The isotropic pyramidal wavelet transform preserves detail, and is efficient in storage and computation. Chapter 10 discusses many aspects of multiscale geometric analysis on the sphere.
-
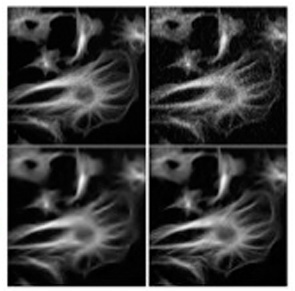
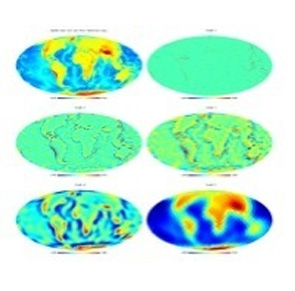
过滤生物医学显微镜图像
- 图像(左上)为荧光微管蛋白丝。右上方是一个嘈杂的版本,带有泊松噪音。较低的图像被过滤,如第6章所述,此噪声过滤是基于孔值转换来保存淡淡的特征。
-
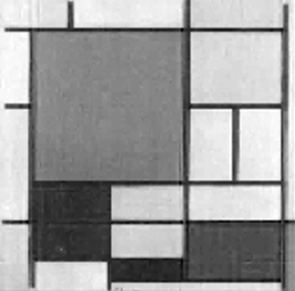
Signal Recovery from Compressed Sampling
- 压缩传感同时样品并压缩信号。Piet Mondrian绘画的图像是第11章中使用的一个示例,用于显示压缩感应如何处理大量图像数据的采集和传输。


